

|
In this article, you will learn how to create a Fishbone Diagram in terms of process excellence, lean six sigma, and lean manufacturing activities. FISHBONE DIAGRAM DESCRIPTIONA Fishbone Diagram (also called a Cause and Effect Diagram or Ishikawa Diagram) is a visualization tool for categorizing the potential causes of a problem in order to identify its root causes. sigma definitions HOW TO PREPARE A FISHBONE DIAGRAM IN SIX 6 SIMPLE STEPS.
FISHBONE DIAGRAM EXAMPLEThe following fishbone diagram was prepared to understand a particular problem of bioburden contamination in medical device products found out of specifications. During the brainstorming were used the six generic headings to present the probable root causes and ideas. As you can see the layers of branches show thorough thinking about the causes of the problem. 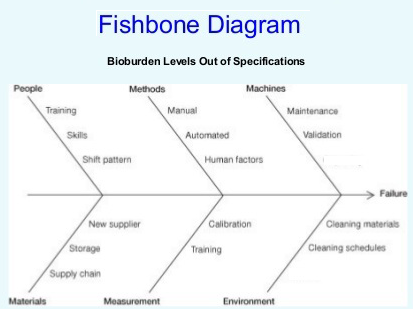
For example, under the heading “Machines,” the idea “maintenance” and “validation” can show how to create a fishbone diagram using several kinds of equipment and then several specific machine models. CIQA is a quality and regulatory consultant with 25 years of experience developing products and managing projects in the medical device supply chain, and pharmaceutical industries. Rest assured of the safety or being in the right hands. Our Lean Manufacturing team could provide you a broad range of professional expertise implementing these techniques and tools. SUBSCRIBE AND FOLLOW US TO LEARN MORE.For more details about How to Create a Fishbone Diagram, follow us.
Three (3) Options to Create Document Control Management DCM Procedures:Bronze Option. You Can Create Your Own Quality Procedures, using a Template.You can download samples of the Document Control Management DCM procedure templates in .pdf format. To see the complete list of the most popular quality procedures templates, click here. In addition, you can request a quotation to buy online a full SOP template document in MS Word format that is completely editable, ready to fill, and adapt to your specific needs. Silver Option. We Can Bring You Formal Training about How to Create a Fishbone Diagram.This option is recommended if you want to learn more about how to build robust quality system procedures. One of our expert(s) can provide online step-by-step training to your team (unlimited assistance) on how to build reliable SOPs using our template(s). Also, you can improve your corporate quality procedures and policies by incorporating our template(s) and tools. It includes a fully editable template from the Bronze option, plus training, exams, and a training certificate for each assistant. Request a quote now. Gold Option. We Can Create Customized Quality Procedures.One of our expert(s) will create and prepare your customized SOPs with the inputs and specific information of your company. It includes a fully editable template from the Bronze option, plus online support in document creation, implementation, and training. Request a quote online. Get in compliance today, CONTACT US (Hablamos Español)REFERENCES: How to Create a Fishbone Diagram.httpss://en.wikipedia.org/wiki/Lean_Six_Sigma httpss://www.greycampus.com/blog/quality-management/a-brief-introduction-to-lean-and-six-sigma-and-lean-six-sigma |